How Regression Models Work
Regression is one of the simplest ideas in machine learning, but it is also one of the most useful. A regression model learns a relationship between inputs and a numeric outcome, then uses that relationship to estimate values it has not seen before.
A company might use regression to estimate next month's revenue from traffic and conversion data. A bank might estimate expected losses from borrower characteristics. An operations team might forecast delivery time from distance, order size and traffic conditions.
The core idea is straightforward:
A regression model looks for a mathematical relationship between features and a continuous target, then chooses the relationship that produces the smallest prediction error on the training data.
Understanding that sentence explains most of what is happening inside a basic regression model.
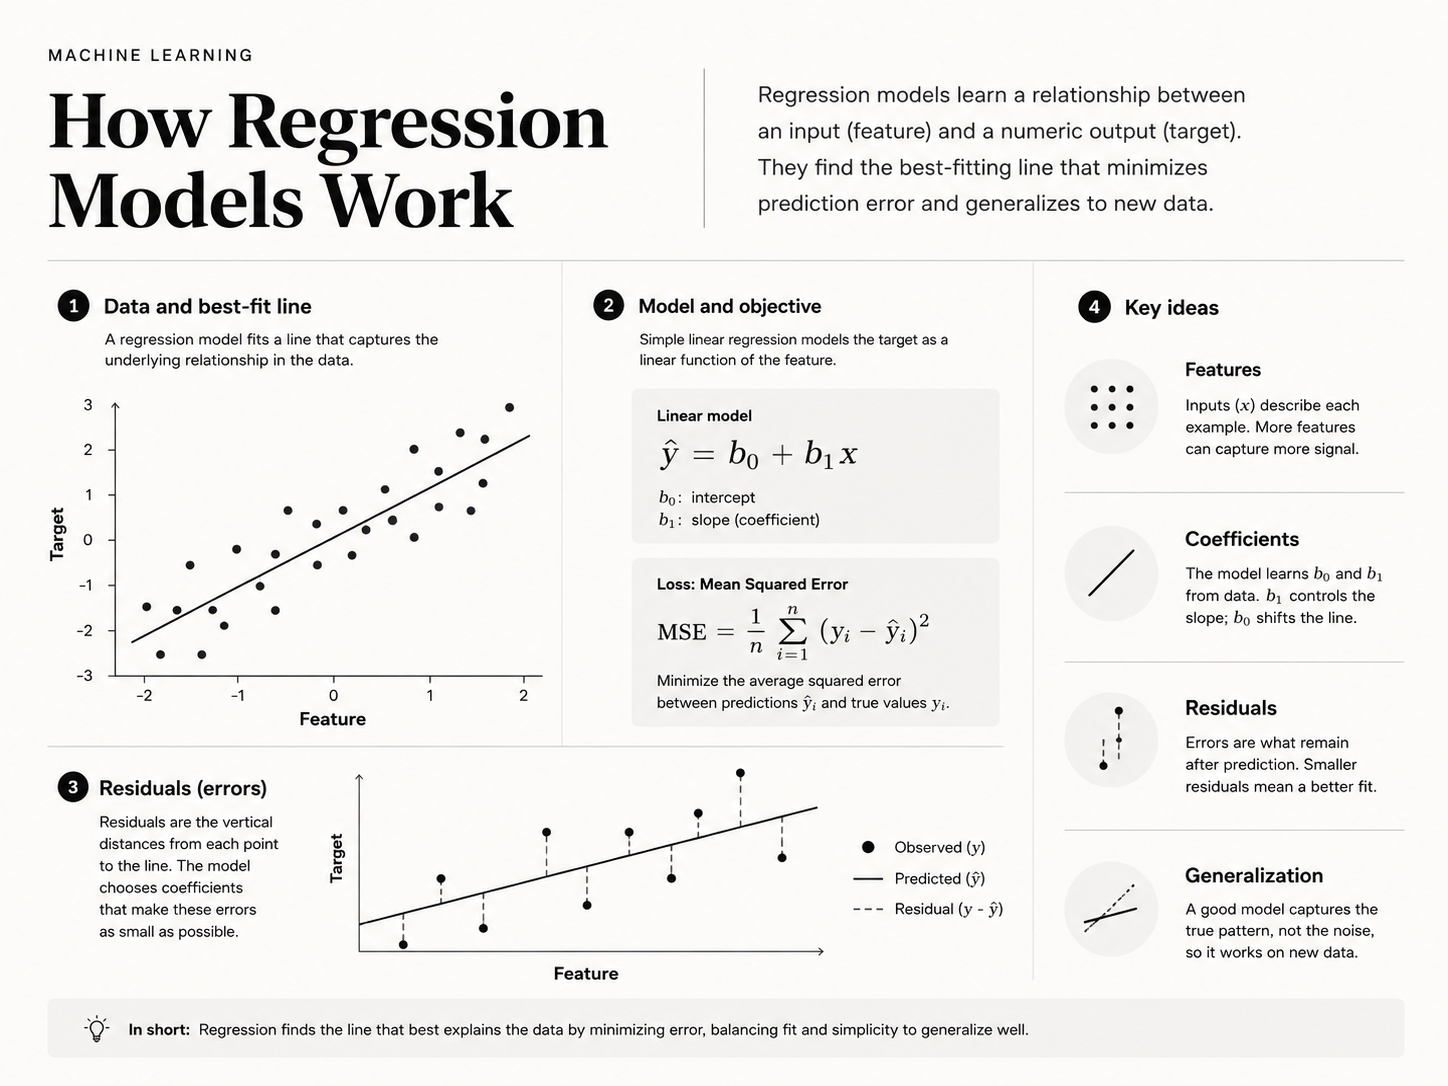
SENA visual explainer: How Regression Models Work.
The problem regression is trying to solve
Imagine a dataset containing the size of apartments and their sale prices:
| Size (sq ft) | Sale price |
|---|---|
| 650 | 280,000 |
| 800 | 335,000 |
| 1,000 | 405,000 |
| 1,250 | 500,000 |
We can see that larger apartments tend to sell for more, but the relationship will not be perfectly exact. Location, age, condition and dozens of other variables also matter.
A regression model tries to turn this pattern into a function.
For a single input, linear regression is commonly written as:
ŷ = b0 + b1x
Where:
ŷis the predicted value.xis the input feature.b0is the intercept.b1is the coefficient, sometimes called the slope.
If the fitted model were:
predicted_price = 120,000 + 300 × size
then a 1,000 sq ft apartment would receive a prediction of 420,000.
The model has not memorised a price for every possible apartment size. It has learned a compact rule that approximates the relationship observed in the data.
Features are the information the model receives
The variables used to make a prediction are called features.
A property model might use:
- floor area,
- number of bedrooms,
- age of the building,
- distance to a train station,
- neighbourhood,
- floor level.
A revenue model could instead use:
- website traffic,
- number of salespeople,
- average selling price,
- advertising spend,
- seasonality.
Once there is more than one feature, the equation becomes:
ŷ = b0 + b1x1 + b2x2 + ... + bnxn
Each coefficient describes how strongly its feature contributes to the prediction within the fitted model, while holding the other included features constant.
That final qualification matters. A coefficient is not automatically proof of causation. Regression learns statistical relationships from the data it receives; it does not magically determine why those relationships exist.
How does the model learn the coefficients?
At the beginning of training, the model does not know which coefficients are useful.
It makes predictions using some candidate coefficients, compares those predictions with the real values, measures the errors and adjusts the coefficients to reduce those errors.
This requires a loss function.
A common loss for regression is mean squared error:
MSE = average((actual - predicted)²)
Suppose the true price is 400,000 and the model predicts 370,000. The residual is 30,000. Squaring errors makes large mistakes contribute disproportionately more to the loss.
Training is therefore an optimisation problem:
Find the coefficients that minimise the chosen loss function.
For ordinary linear regression, this can be solved mathematically. Larger machine-learning models often rely on iterative optimisation methods such as gradient descent, but the principle is the same: change the parameters in a direction that reduces error.
Residuals show where the model is wrong
A residual is the difference between an observed value and the value predicted by the model:
residual = actual - predicted
Residuals are useful because they show whether the model's errors look random or systematic.
If a model consistently underestimates expensive homes, for example, that pattern may indicate that a simple straight line is not flexible enough. If residuals get larger as predicted values increase, the variance of the errors may be changing.
Good regression analysis therefore involves more than looking at a single accuracy score. The pattern of errors often tells you what the model has failed to capture.
What makes linear regression "linear"?
Linear regression is linear in its parameters. It assumes that the prediction can be expressed as a weighted sum of features.
That does not mean every raw feature must appear as a straight-line relationship.
You can introduce transformed features such as:
x²,log(x),- interaction terms such as
x1 × x2.
A model using x and x² can represent a curved relationship while still being a linear regression model with respect to its coefficients.
This is useful, but it also introduces more opportunities to overfit.
How do we measure whether a regression model is good?
No single metric is best for every problem.
Mean Absolute Error
MAE measures the average absolute difference between predictions and actual values.
It is easy to interpret because it stays in the same units as the target. If the MAE of a delivery-time model is 4.5 minutes, its typical absolute error is about 4.5 minutes.
Root Mean Squared Error
RMSE takes the square root of mean squared error.
It also remains in the target's units, but it penalises larger mistakes more heavily than MAE.
R-squared
R² measures how much of the variation in the target is explained by the model relative to a simple baseline using the mean.
An R² closer to 1 usually means the model explains more variation, but a high R² does not guarantee that the model is useful, causal or reliable outside the training data.
For production work, the most important test is usually performance on unseen validation or test data.
Training performance is not the goal
A regression model can fit historical data extremely well and still fail on new data.
This is called overfitting.
Overfitting becomes more likely when:
- the dataset is small,
- there are too many features,
- the model is unnecessarily flexible,
- noisy variables are included,
- evaluation is performed on the same observations used for training.
The purpose of machine learning is not to explain the training set perfectly. It is to learn patterns that generalise.
That is why datasets are commonly separated into training and validation or test sets.
Regularisation keeps models from becoming too complex
Regularisation adds a penalty for large coefficients.
Two common approaches are:
- Ridge regression, which penalises squared coefficient size.
- Lasso regression, which penalises absolute coefficient size and can drive some coefficients to zero.
Regularisation trades a little training-set fit for a model that may behave better on unseen data.
This is a recurring idea throughout machine learning: the best model is rarely the one that memorises the historical dataset most aggressively.
The assumptions behind basic linear regression
Classical linear regression is often taught with assumptions about the data and residuals. The precise assumptions depend on whether your goal is prediction or statistical inference, but common considerations include:
- The relationship is reasonably represented by the chosen linear form.
- Observations are sufficiently independent.
- Error variance is not changing dramatically across predictions.
- Predictors are not so strongly redundant that coefficients become unstable.
- For some forms of statistical inference, assumptions about the distribution of errors are also important.
Machine-learning applications sometimes care less about textbook statistical inference and more about predictive performance. Even then, checking these behaviours helps diagnose poor models.
Correlation is not causation
Suppose a regression finds that ice-cream sales and electricity usage rise together.
That does not mean ice-cream purchases cause electricity demand. A third factor—temperature—may influence both.
This illustrates a crucial limitation:
Regression estimates relationships conditional on the data and variables supplied to it. Causal claims require stronger assumptions, experimental design or specialised causal methods.
A coefficient may be highly predictive without being a causal effect.
When should you use regression?
Regression is a strong baseline when:
- the output is numeric,
- interpretability matters,
- you need a fast model,
- the dataset is not enormous,
- relationships are roughly additive or can be represented with transformations,
- you want a benchmark before trying more complex methods.
Common applications include pricing, demand forecasting, financial planning, capacity prediction, risk estimation, lifetime-value modelling and operational forecasting.
Even when a more sophisticated model eventually performs better, regression gives you a useful reference point.
What regression teaches us about machine learning
Regression introduces several ideas that reappear almost everywhere in modern AI:
- features represent the information available to the model,
- parameters determine how inputs affect outputs,
- predictions are compared with observed outcomes,
- a loss function measures mistakes,
- optimisation searches for better parameter values,
- evaluation on unseen data measures generalisation.
Neural networks contain vastly more parameters and much more complicated transformations, but training still revolves around these same principles.
Key takeaways
- Regression predicts a continuous numeric target from one or more features.
- Linear regression represents the prediction as a weighted sum of features.
- Coefficients are learned by minimising a loss function.
- Residuals reveal how and where the model makes mistakes.
- MAE, RMSE and R² describe different aspects of model performance.
- Good training fit does not guarantee good performance on new data.
- Regression describes statistical relationships; it does not automatically prove causation.
Frequently asked questions
What is the difference between regression and classification?
Regression predicts a continuous number, such as price, demand or temperature. Classification predicts a category or class, such as fraud/not fraud or spam/not spam.
Is linear regression considered machine learning?
Yes. It is both a classical statistical method and a supervised machine-learning algorithm. The terminology depends on how it is being used.
Why square the errors in linear regression?
Squaring removes negative signs and penalises large errors more heavily. It also gives the objective useful mathematical properties that make optimisation convenient.
Can regression handle categorical data?
Yes, but categories usually need to be encoded into numeric features, for example with indicator or one-hot variables.
Why start with regression if more advanced models exist?
Because a simple model is fast, interpretable and difficult to beat when the underlying relationship is reasonably simple. It also establishes a baseline that tells you whether extra complexity is actually helping.